
Ok, you’re in HQ, coffee in one hand, phone buzzing in the other. The Quarterly Business Review (QBR) is in full swing, and the execs are flashing financial results on the big screen live. No time to blink.
Your boss leans in:
“So… we need to brief the team after the QBR. Can we pay the bills? Are we running out of cash?”
“We need to tell them where we stand …”
You have minutes to scan the numbers, decode the liquidity ratios, and sound like you’ve had this figured out all quarter. Are we liquid enough to survive a shock, or are we one bad quarter away from a crisis? That’s where the right liquidity ratios come in.
We will focus on the following industries: Consulting (Market Research and Strategy, IT Consulting companies), Tech (SaaS and AI companies, no Hardware companies with inventories), Fintech (payments processors and Crypto Exchange companies), Finance (Banks, Hedge Funds, Insurance, Wealth, Asset Management institutions and also Lending Fintech companies).
For Consulting and Tech companies, the Quick Ratio [1] is the best liquidity measure because they sell services, not physical goods, making inventory irrelevant. The Cash Ratio is ideal for Fintech companies, as they must always have enough cash-on-hand to process withdrawals and transactions instantly. Finally, the Liquidity Coverage Ratio (LCR) is used for Banks since it includes more than just cash and ensures they can survive liquidity crises.
1. The Acid Test for Consulting and Tech companies

✅ Quick Ratio between 1 and 2: Consulting and Tech companies can pay the bills fine.
| Interpretation by industry | 🚩 Inferior to 1 | 🚩 Superior to 2 |
|---|---|---|
| Consulting | Risky, must ensure strong client payment cycles and optimize working capital to avoid liquidity crunches. | Too much idle cash, should reinvest in acquisitions, talent expansion, or technology upgrades. |
| Tech | Not always bad, may signal a reinvestment-heavy business, especially for high-growth startups burning cash for market capture. | Too much idle cash, should reinvest in R&D, product innovation, or scaling operations. |
More about the ratio calculation:
Current Assets = Cash (immediate liquidity) + Receivables (money owned by customers and collectable soon) + Marketable Securities (short-term investments in securities) + Prepaid Expenses (expenses paid in advance for services or products that will be used in the future like rent, insurencies and subscriptions) + Short-Term Loans + Other Liquid Assets
Current Liabilities = Payables (money owned to suppliers and payable soon) + Short-Term Debt (bank overdrafts, short-term loans)+ Accrued Expenses (expenses incurred but not yet paid like wages, utilities and taxes) + Deferred Revenue (payments received for services or products not yet delivered which is common in SaaS and subscription businesses) + Dividends Payable + Lease Liabilities + Other Short-Term Liabilities
Working Capital (WC) = Current Assets – Current Liabilities
Please note that the true formula of the Quick Ratio is [(Current Assets – Inventory) / Current Liabilities]. However, I removed Inventory (goods available for sales) from the Current Assets calculation, as we are dealing with Consulting and Tech companies that sell services rather than physical goods. As a result, since Inventory = 0 in this context, the Quick Ratio calculation methodology is identical to the Current Ratio methodology.
2. The Stress Test for Fintech companies

✅ Cash Ratio between 1 and 2: Fintech companies can pay the bills fine.
| Interpretation by industry | 🚩 Inferior to 1 | 🚩 Superior to 2 |
|---|---|---|
| Fintech | If tied to a weak Operating Cash Flow, there is a liquidity risk, as clients expect instant withdrawals and payments that require immediate cash availability. | Too much idle cash, should reinvest in yield-generating assets like short-term loans, treasury bonds, or high-yield deposits. |
More about the ratio calculation:
Cash & Cash Equivalents = Cash on Hand (physical cash like bills, coins or petty cash) + Bank Deposits (checking & savings account balances) + Cash Equivalents (highly liquid short-term investments like treasury bills, money market funds, commercial paper, certificates of deposit maturing within 3 months)
Operating Cash Flow (OCF) = Net Income (bottom-line profit after deducting all expenses including taxes, interest, and depreciation from the total revenue) + Non-Cash Expenses (we add back the expenses that reduce the income but did not actually used cash such as depreciation, amortization, payments to employees in stock rather than cash) + Changes in Working Capital (Changes in Current Assets minus changes in Current Liabilities)
Free Cash Flow (FCF) = Operating Cash Flow (OCF) − Capital Expenditures (CAPEX is money spent on physical assets such as buildings, equipment or R&D)
A low Cash Ratio and a weak Operating Cash Flow (OCF) suggest that the company is not generating enough cash from its core business to sustain real-time transactions. In such cases, it may have to rely on external financing or short-term borrowing to cover cash shortfalls, increasing financial vulnerability. It will impact even more the cash left after investments, i.e. the Free Cash Flow (FCF).
3. The Solvency Test for Banks
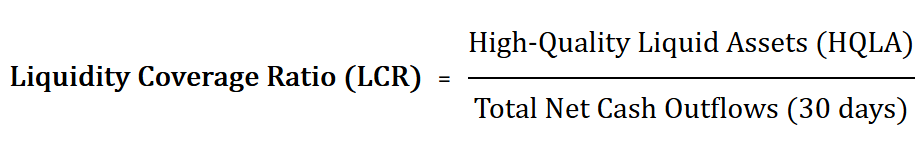
✅ Liquidity Coverage Ratio between 1 and 2: Fintech companies can pay the bills fine.
| Interpretation by industry | 🚩 Inferior to 1 | 🚩 Superior to 2 |
|---|---|---|
| Finance | Not acceptable for regulated banks. Basel III requires LCR > 1 to ensure banks can survive a liquidity shock. However, non-bank lenders and hedge funds may operate below 1, but it increases their risky reliance on external funding. | Rare, as banks and lenders typically deploy most of their funds into loans, investments, or securities rather than holding cash. |
High-Quality Liquid Asset (HQLA) = Cash & Cash Equivalents + Highly Liquid Government Securities (T-bills, short-term sovereign bonds) + Central Bank Reserves (deposits held at central banks that are only applicable for banks, not fintech lenders).
Total Net Cash Outflows = (Expected Outflows – Expected Inflows) over 30 days
Expected Outflows = Loan Disbursements (expected loans issued over the next 30 days) + Customer Withdrawals (expected cash withdrawals from depositors) + Debt Repayments (any maturing short-term debt) + Operational Expenses (payroll, rent, tech infrastructure, marketing) + Wholesale Funding Maturities (maturing short-term funding sources)
Expected Inflows = Loan Repayments (scheduled borrower payments expected in the next 30 days) + Interest & Fees Collected (revenue from interest on loans & service fees) + New Borrowings (fresh credit lines from banks or investors if applicable) + Maturing Assets (short-term bonds and securities that generate cash flow)
Financing Cash Flow (CFF) = New Debt (bank loans, bond issuance, credit lines) + New Equity (selling company shares to raise capital, external Venture Capital and Private Equity funding) – Debt Repayments (loan principal repayment, interest payments, bond redemptions) – Dividends (either direct payouts in cash to shareholders or issuing additional shares diluting the Earnings Per Share)
The CFF is the cash the organization must raise through financing activities to stay liquid: Required CFF = Total Net Cash Outflows − Available HQLA.
Banks can use customer deposits as a funding source. Their CFF decisions are also regulated by Basel III capital & liquidity requirements. But fintech lenders cannot rely primarily on revenue from sales or deposits. They have fewer funding options and are more sensitive to capital market conditions. Hence they must borrow money or rely on external funding such as issuing bonds or raising capital from investors to sustain operations and expand loan portfolios.
4. Lessons from Major Collapses on Why Liquidiy Ratios Matter
Liquidity ratios are not just financial metrics, they are early warning signs of instability. When companies mismanage their liquidity, they can collapse shockingly fast, even if they seem financially strong on paper. Here’s how three major firms fell apart due to liquidity failures.
McKinsey (2002). McKinsey faced a liquidity crisis as mounting legal expenses from the Enron scandal drained its cash reserves. Enron collapsed into bankruptcy when its abuse of accounting loopholes to hide massive debts and inflate profits was exposed. McKinsey had shaped Enron’s aggressive growth model, which ultimately failed, leading to client distrust and reputational damage. As a result, new contracts slowed down, cutting off operating cash flow, which weakened their Quick Ratio. The firm had to restructure to stabilize its finances, distancing itself from the scandal and restoring trust.
FTX (2022). FTX had a terrible Cash Ratio because it held almost no liquid assets, with most funds tied up in illiquid tokens (FTT). When users rushed to withdraw deposits in early November 2022, the exchange didn’t have enough cash to cover liabilities, leading to a sudden liquidity crisis and bankruptcy on November 11, 2022. The lack of proper cash reserves exposed severe financial mismanagement, forcing its collapse.
Silicon Valley Bank (2023). Silicon Valley Bank collapsed due to a dangerously low Liquidity Coverage Ratio (LCR), as it held excessive long-term bonds that lost value when interest rates rose. When venture-backed startups began withdrawing deposits, SVB lacked sufficient high-quality liquid assets (HQLA) to cover the outflows, triggering a bank run. On March 10, 2023, SVB failed, marking the second-largest bank collapse in U.S. history, exposing the dangers of weak liquidity management.